
Application of Semiconductor Lasers in Shifted Excitation Raman Difference Spectroscopy
1. Raman Spectroscopy
In 1928, Indian physicist C.V. Raman discovered the Raman scattering effect. He found in experiments that when monochromatic light (typically laser light) irradiates a substance, photons undergo elastic collisions with molecules. This portion of scattered light has the same wavelength as the incident light and provides no useful information; this is called Rayleigh scattering. When photons undergo inelastic collisions with molecules, the wavelength of the scattered light changes relative to the incident light. This phenomenon is known as Raman scattering[1].
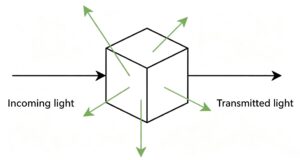
Figure 1. Schematic diagram of light scattering.
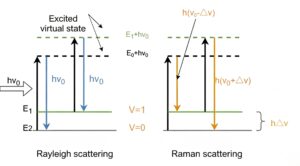
Figure 2. Energy-level diagram of Rayleigh and Raman scattering.
Raman scattered light is symmetrically distributed on both sides of Rayleigh scattered light, but its intensity is much lower than that of Rayleigh scattering, approximately 10⁻⁶ to 10⁻⁹ of the Rayleigh scattering intensity.
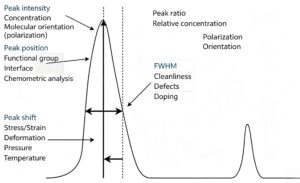
Figure 3. Schematic diagram of Raman peak parameter analysis.
A Raman spectrum consists of a certain number of Raman peaks, each representing the wavelength position and intensity of the corresponding Raman scattering. Each peak corresponds to a specific molecular bond vibration, such as C–C, C=C, C–H, etc., and also includes vibrations of groups composed of multiple chemical bonds.
Through molecular bond vibrations, the composition of a substance can be analyzed; changes in Raman peak positions can be used to determine some mechanical properties of the material under study; the intensity of Raman peaks reflects the total amount of the substance; the width of Raman peaks can indicate crystal quality; and the polarization of Raman peaks reflects the symmetry and orientation of crystals.
Generally speaking, Raman spectroscopy is a unique chemical fingerprint for specific molecules or materials, enabling rapid confirmation of material types as well as differentiation between different materials. Raman spectral databases contain thousands of spectra; through rapid searching, spectral data matching the substance being analyzed can be found.
2. Shifted Excitation Raman Difference Spectroscopy (SERDS)
When a sample is irradiated with laser light, Raman scattering can be excited, but fluorescence is also excited simultaneously. The intensity of Raman scattering is very weak, while the intensity of fluorescence is 106 to 108 times that of Raman scattered light. Therefore, fluorescence greatly affects the accuracy of Raman detection [2].
Fluorescence suppression methods and techniques are therefore particularly important. Currently commonly used fluorescence suppression methods mainly include fluorescence quencher methods, photobleaching methods, infrared/ultraviolet excitation methods, wavelet transform methods, polarization modulation methods, gating methods, etc. However, these methods all have more or less drawbacks. For example, the fluorescence quencher method introduces chemical substances that may cause sample contamination; the photobleaching method, through continuous irradiation of the sample, may cause photodamage/thermal damage to the sample, and so on.
Scientists have discovered another method: Shifted Excitation Raman Difference Spectroscopy (SERDS). SERDS uses two lasers with closely spaced wavelengths to excite the sample separately. According to Kasha’s rule, small energy changes in excitation photons do not affect the fluorescence background, but they cause a shift in the Raman spectrum [3]. The Raman spectrum changes with the laser wavelength, while fluorescence barely changes with wavelength. By subtracting the spectra obtained after excitation with two closely spaced wavelengths, the resulting difference spectrum has its fluorescence background almost completely eliminated.
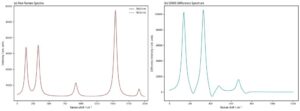
Figure 4. Left: Raman spectrum of a 784/785 nm dual-wavelength laser (schematic). Right: Raman spectrum after difference processing (schematic).
Comparing SERDS with the several fluorescence elimination methods mentioned above, SERDS is a non-destructive, chemically contact-free method that requires no sample pretreatment. It does not cause deviations in experimental data due to the polarization characteristics of the sample, and the analysis speed is also faster.
3. Applications of SERDS
SERDS has wide applications in fields such as chemistry, medicine, food, and environmental science. At the same time, SERDS can be used in combination with other spectroscopic techniques, such as Surface-Enhanced Raman Spectroscopy (SERS), Raman microscopy, Raman spectral imaging, etc.
In the environmental and food fields, samples often have strong fluorescence backgrounds, which greatly affects sample measurement. Measuring soil fertility indicators is of great significance to agriculture. Applying different fertilizers and pesticides according to different soil fertilities can greatly increase yield and also contribute to environmental protection to a certain extent. Kay Sowoidnich et al. used a 784/785 nm dual-wavelength laser to eliminate fluorescence interference in soil measurements and separate molecular fingerprint signals of minerals such as quartz and calcite from organic molecules [4]. At the same time, Sowoidnich K et al. used a 784/785 nm dual-wavelength laser to measure the molecular fingerprints of various components in livestock and poultry feed, selecting the most suitable feed for livestock and poultry to achieve optimal production performance and condition [5].
The 784.6 nm / 785.2 nm dual-wavelength SERDS system used by the Sowoidnich team employs an electronically controlled alternating modulation method. The experiment uses a λ₁ single-exposure – λ₂ single-exposure cyclic alternating acquisition scheme to avoid fluorescence drift and photobleaching caused by batch acquisition. The time interval between adjacent wavelength acquisitions is controlled within tens of milliseconds (20–100 ms), ensuring that the fluorescence baselines of the two measurements are approximately consistent.
4. Advantages of 784/785 nm Lasers for SERDS
Raman peaks change with the excitation wavelength, while fluorescence barely changes. Therefore, choosing lasers with closely spaced wavelengths at 784/785 nm can more clearly remove fluorescence interference, while not causing the Raman peak difference to be too low (which would prevent effective differencing) due to too small a wavelength difference, nor causing changes in the fluorescence spectrum due to too large a wavelength difference. Compared with lasers of other wavelength bands, the photon energy around 785 nm is lower, which reduces the total amount of fluorescence excited from the sample, facilitating difference calculations. At the same time, the wavelength of Raman light after 785 nm scattering is in the range of 830–1010 nm, which allows the use of cheaper silicon CCD acquisition equipment.
RealLight independently develops a full set of domestically produced Raman spectroscopy optical equipment, which can be used to build complete Raman analysis platforms. Its product portfolio covers NLSO single-mode and NLMO multi-mode conventional narrow-linewidth Raman laser modules, the dual-wavelength lasers developed for Shifted Excitation Raman Difference Spectroscopy (SERDS) technology, as well as supporting RL-RP series standardized Raman collection probe dedicated heat dissipation modules and customized filter optical accessories.
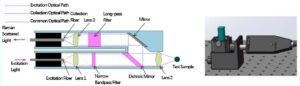
Figure 5. Schematic diagram of Raman probe structure.
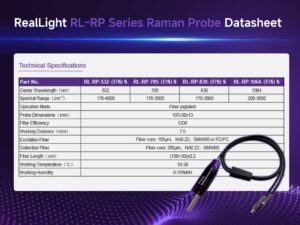
Figure 6. RealLight standard Raman Probe parameters.
According to different application scenarios, this series provides two product forms: NLM series benchtop lasers and NLMO series embedded laser modules. Both have the same core optical performance, covering seven mainstream excitation bands: 532 nm, 638 nm, 785 nm, 808 nm, 830 nm, 981 nm, and 1064 nm. Using 105 μm / 0.22 NA fiber output, the output power range is 100–800 mW. Except for the 808 nm and 981 nm bands with linewidth < 0.3 nm, all other bands have spectral linewidth < 0.1 nm; wavelength stability is better than ±7 pm under 4 hours of continuous operation (±5 pm for 532 nm), power peak-to-peak fluctuation < ±2%, and side mode suppression ratio (SMSR) up to 40 dB or higher.
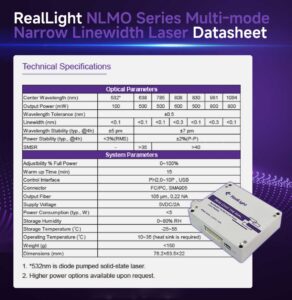
Figure 7. NLMO series multi-mode narrow-linewidth laser module and parameter table.
The NLM series is a benchtop complete machine form, equipped with a display screen, circuit system, heat dissipation module, and hardware emergency stop switch, supporting USB communication and 0–5 V analog modulation, suitable for laboratory benchtop Raman systems and industrial online detection equipment. The NLMO series is a miniature integrated module with typical power consumption < 5 W, suitable for integrated development of portable Raman equipment and OEM batch supporting.
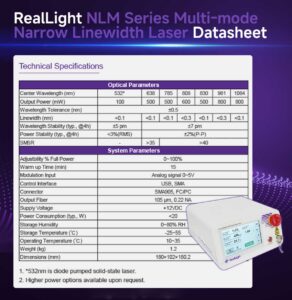
Figure 8. NLM series multi-mode narrow-linewidth laser and parameter table.
Conventional single-wavelength lasers use VBG (Volume Bragg Grating) frequency-locking technology, featuring narrow output spectral linewidth and excellent long-term stability of wavelength and output power. They are suitable for conventional Raman qualitative characterization of samples with weak fluorescence interference, such as minerals and chemical raw materials. For complex systems such as soil and biological matrices that have strong autofluorescence and where conventional Raman signals are easily masked, the 784.5/785.5 nm dual-wavelength narrow-linewidth semiconductor laser module launched by RealLight provides the core excitation unit for SERDS detection solutions. The device integrates two independent constant-temperature frequency-locking optical paths within a single chassis, fully meeting the physical requirements of SERDS difference operations. The two laser channels support millisecond-level electronically controlled alternating switching, with switching delay controlled within 5 ms, achieving up to 100 Hz square-wave timing modulation, and are equipped with a hardware synchronization trigger interface that can achieve signal linkage with cooled CCD spectrometers and motorized XY translation stages. Using a short-interval cyclic acquisition mode to complete Raman data acquisition at two wavelengths, it effectively reduces the difference artifact peak interference caused by photobleaching of soil organic matter and fluorescence baseline drift during batch acquisition, improving data stability.
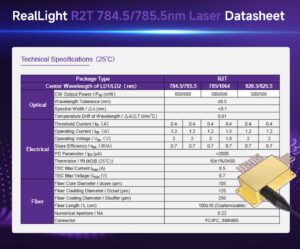
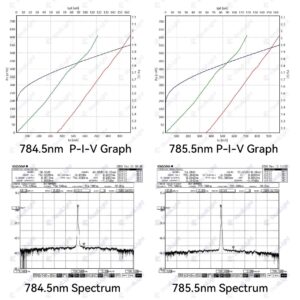
Figure 9. 784.5/785.5 nm laser physical image, parameter table (left), and measured spectrum (right).
This dual-wavelength series also provides two forms: benchtop complete machine (NLM dual-wavelength) and embedded module (NLMO dual-wavelength). The NLM dual-wavelength is equipped with a display screen, circuit system, heat dissipation module, and hardware emergency stop switch, suitable for laboratory benchtop SERDS system construction; the NLMO dual-wavelength module has typical power consumption < 5 W, suitable for portable differential Raman equipment integration.
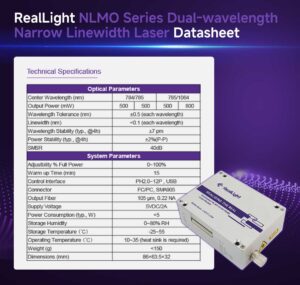
Figure 10. NLMO series multi-mode dual-wavelength narrow-linewidth laser module and parameter table.
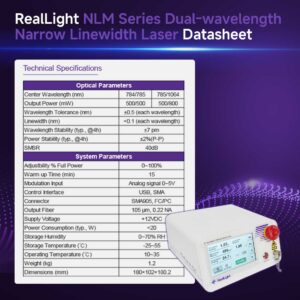
Figure 11. NLM series multi-mode dual-wavelength narrow-linewidth laser and parameter table.
Combining this dual-wavelength light source with the RL-RP series high-OD Raman probe and supporting isolation filter devices, a domestically produced SERDS difference Raman detection system can be constructed. The entire optical platform can perform millimeter-scale grid scanning tests on farmland surface soil. Through difference algorithms, the broad fluorescence background generated by humus is removed, completely separating the characteristic Raman peaks of typical soil components such as quartz, feldspar, calcite, anatase, and amorphous carbon. The entire set of equipment is independently manufactured domestically. Compared with imported dual-wavelength SERDS optical systems of the same type, it has shorter procurement cycles, lower post-maintenance costs, and hardware parameters that can be flexibly customized for different usage scenarios such as laboratory benchtop analysis and field portable in-situ screening, providing reliable domestic hardware support for SERDS technology research.
Disclaimer: Part of the content in this article comes from the Internet, for the purpose of technical research and exchange, and is for reference and study only. If there are errors in description or academic inaccuracies, please feel free to raise them in a timely manner. If copyright issues are involved, please contact us and we will verify and delete the content as soon as possible.
Referenzen
[1] Raman C V. A new radiation[J]. Indian Journal of Physics, 1928, 2: 387-398.
[2] Liu Y L, Mou T T, Chen S H. Review of research progress in shifted excitation Raman difference spectroscopy [J]. Laser & Optoelectronics Progress, 2024, 61(9): 0900003. DOI: 10.3788/LOP231206
[3] Lin J Y, Lin D, Qiu S F, et al. Shifted-excitation Raman difference spectroscopy for improving in vivo detection of nasopharyngeal carcinoma[J]. Talanta, 2023, 257: 124330.
[4] Sowoidnich K, Vogel S, Maiwald M, et al. Determination of Soil Constituents Using Shifted Excitation Raman Difference Spectroscopy[J]. Applied Spectroscopy, 2022, 76(6): 712-722. DOI: 10.1177/00037028211064907.
[5] Sowoidnich K, Oster M, Wimmers K, et al. Shifted excitation Raman difference spectroscopy as enabling technique for the analysis of animal feedstuff[J]. Journal of Raman Spectroscopy, 2021, 52(8): 1418-1427. DOI: 10.1002/jrs.6140.
Häufig gestellte Fragen
1. Both SERDS (Shifted Excitation Raman Difference Spectroscopy) and time-gated Raman can suppress fluorescence; how should one choose between them?
SERDS operates in the spectral domain; it acquires two sets of spectra using two excitation wavelengths with a slight offset and performs a differential calculation to eliminate the constant fluorescence background. It does not require pulsed lasers or gated detectors, relying instead on a continuous-wave (CW) narrow-linewidth laser and a standard CCD. It is well-suited for analyzing static, highly fluorescent samples such as soil or biological specimens.
Gated Raman operates in the time domain; it exploits the difference in lifetimes between Raman scattering and fluorescence. By using a pulsed laser combined with an ICCD gated detector for time-gating, it is better suited for long-range detection and non-contact analysis of hazardous chemicals. The system requires a pulsed light source and a synchronization timing link (often involving a photodiode). In practical applications, the two techniques can also be combined to further suppress background noise.
2. Why does SERDS technology use the specific wavelength pair of 784.5 nm and 785.5 nm? Can’t the wavelength difference be set arbitrarily?
If the wavelength difference is too small, the shift in Raman peaks between the two excitations is negligible, resulting in a very weak effective signal after differentiation. Conversely, if the difference is too large, Kasha’s rule is violated; the fluorescence spectrum itself changes, preventing the differential process from completely eliminating the fluorescence background.
The wavelength difference of approximately 1 nm (between 784.5 nm and 785.5 nm) has been validated by extensive literature to satisfy the requirements for SERDS differentiation. Additionally, the lower photon energy in the near-infrared range minimizes the risk of photobleaching damage to the sample.





 777
777