
Principles of Confocal Micro-Raman Spectroscopy and Laser Source Selection Recommendations
소개
The microscopic structure of a material directly determines its macroscopic performance. In research on thin-film coatings, semiconductor chips, mineral inclusions, biological tissues and similar systems, it is often necessary to perform non-destructive characterization of the composition, crystalline phase, crystal quality and stress state of a local region at the micrometer scale. Conventional Raman spectroscopy has no spatial filtering capability: the collected signal is an average over the entire illuminated spot and therefore cannot satisfy the requirements of micro-area analysis. Confocal micro-Raman spectroscopy combines a laser microscope system, confocal technology and a Raman detection system. A single-mode Gaussian laser beam is focused onto a micro-area of the sample, a confocal pinhole suppresses out-of-focus stray light, and optical filters remove the strong Rayleigh scattering, so that the Raman scattering generated at the target focal point is collected. This method not only acquires the characteristic Raman shift at a single point for material identification and polymorph discrimination, but also produces component-distribution mapping through two-dimensional scanning and depth sectioning through Z-axis scanning. With both high spatial resolution and molecular fingerprinting capability, it has become a mainstream technique for non-destructive characterization of micro-scale structures.
1. Development of Raman Technology
In 1928, the Indian physicist C. V. Raman discovered the Raman scattering effect. In his experiments he observed that when monochromatic light (usually laser light) irradiates a material, some photons collide elastically with molecules; this scattered light has the same wavelength as the incident light, carries no useful information and is called Rayleigh scattering. Photons that collide inelastically with molecules produce scattered light whose wavelength differs from that of the incident light, and this phenomenon is called Raman scattering [1].
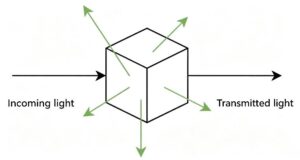
Figure 1. Schematic of Raman scattering
Raman scattered light is distributed symmetrically on both sides of the Rayleigh line, but its intensity is much lower than that of Rayleigh scattering, typically about 10⁻⁶-10⁻⁹ of the Rayleigh intensity.
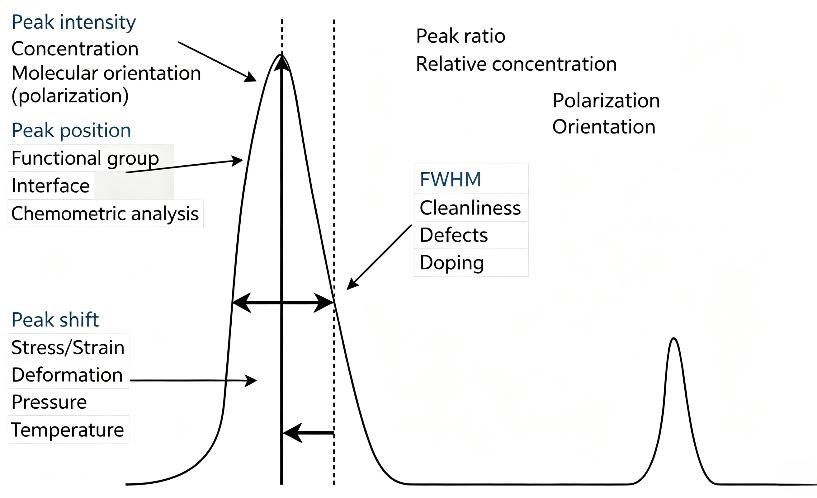
Figure 2. Schematic of the spectral peak parameters of a Raman spectrum
A Raman spectrum consists of a certain number of Raman peaks, each representing the wavelength position and intensity of the corresponding Raman scattering. Every peak corresponds to a specific molecular bond vibration, such as C-C, C=C or C-H, and also to the vibration of a functional group composed of several chemical bonds.
The composition of a material can be identified from molecular bond vibrations; part of the mechanical properties of the material under study can be inferred from shifts in Raman peak position; the intensity of a Raman peak indicates the relative amount of the substance; the width of a Raman peak reflects crystal quality; and the polarization state of a Raman peak reflects the symmetry and orientation of the crystal.
2. Principles of Micro-Raman Spectroscopy
In the 1990s, Raman spectroscopy began to be deeply combined with optical microscopy, and researchers integrated Raman detection modules with microscopic optical paths to develop micro-Raman spectroscopy. Using a high numerical aperture (NA) objective, this technique focuses the excitation laser into a micrometer-sized spot and enables Raman signal acquisition from very small samples, laying the foundation for the later confocal Raman imaging systems.
Early micro-Raman imaging relied mainly on point-by-point Raman mapping: a motorized stage moves the sample, spectra are acquired point by point, and the internal composition distribution of the sample is reconstructed from the data. Lateral resolution can reach the micrometer level, but the main drawback is very slow acquisition. For example, for a 60 × 60 pixel map with 1 s integration per point, spectral acquisition alone requires 3600 s, i.e. one hour; adding sample alignment, signal readout and scan reset, the total time is even longer. For a large 200 × 200 pixel image, the acquisition cycle becomes unacceptable without optimization. To make Raman imaging genuinely practical, the single-point integration time must be shortened, preferably below 100 ms.
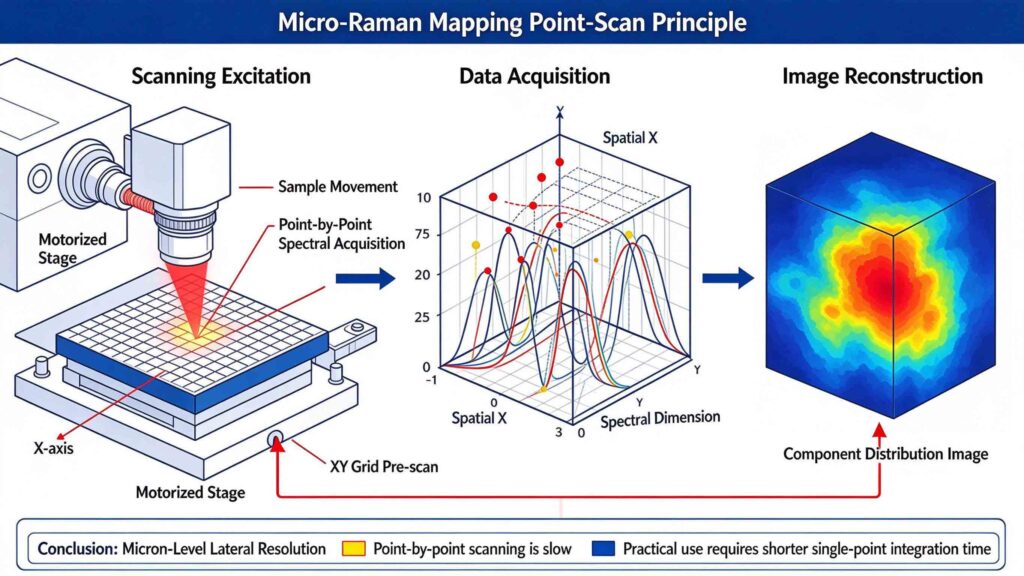
Figure 3. Schematic of point-by-point scanning micro-Raman mapping
To overcome the speed limitation, researchers developed two classes of non-confocal parallel acquisition schemes. The first is line-imaging Raman: a line-shaped light source illuminates a linear region of the sample, and the scattered light from this line is projected directly onto the spectrometer slit. One CCD axis records spatial position while the other records spectral dispersion, so the Raman spectra of hundreds of points along the line are acquired simultaneously in a single exposure. The second is global wide-field Raman imaging: the whole region of interest is uniformly illuminated and the Raman scattered light is imaged directly onto the CCD after passing through a narrow-band filter, so that a characteristic image of the entire sample is obtained in a single exposure without point scanning. However, both schemes lack the spatial filtering capability of confocal detection: line imaging replaces the confocal pinhole with a slit, and wide-field imaging removes the pinhole altogether, so neither can effectively reject fluorescence and stray light outside the focal plane. Their background suppression and spatial resolution are therefore inferior to confocal systems, and their performance degrades markedly for samples with complex matrices and strong fluorescence [2].
Confocal micro-Raman spectroscopy integrates a microscopic focusing path, a confocal filtering structure and a Raman scattering detection system. After collimation, the excitation laser is directed by a dichroic mirror into the microscope objective, which focuses the TEM₀₀ Gaussian beam to form a micrometer-sized illumination focus inside the sample. Raman scattering, Rayleigh scattering and fluorescence are generated at the focal point, and the scattered light travels back along the same optical path and is collected by the objective again.
The sample focus and the confocal pinhole are optically conjugate planes, so only the scattered light generated at the focal plane converges precisely and passes through the pinhole. Stray light and fluorescence from regions above and below the focal plane converge at a position offset from the pinhole and are blocked by the aperture, achieving out-of-focus signal rejection [3]. The beam transmitted through the pinhole then passes through a notch filter, which removes the Rayleigh scattering that is far stronger than the Raman signal, before being dispersed by a grating and collected by a photodetector. Two-dimensional scanning of the stage or the beam allows spectra to be acquired point by point and the component distribution image of the sample to be reconstructed; adjusting the objective height along the Z axis additionally provides depth sectioning and structural information from different thin layers of the sample. This mechanism gives the system both micrometer-level lateral resolution and optical sectioning capability, making it suitable for non-destructive micro-area characterization [4].
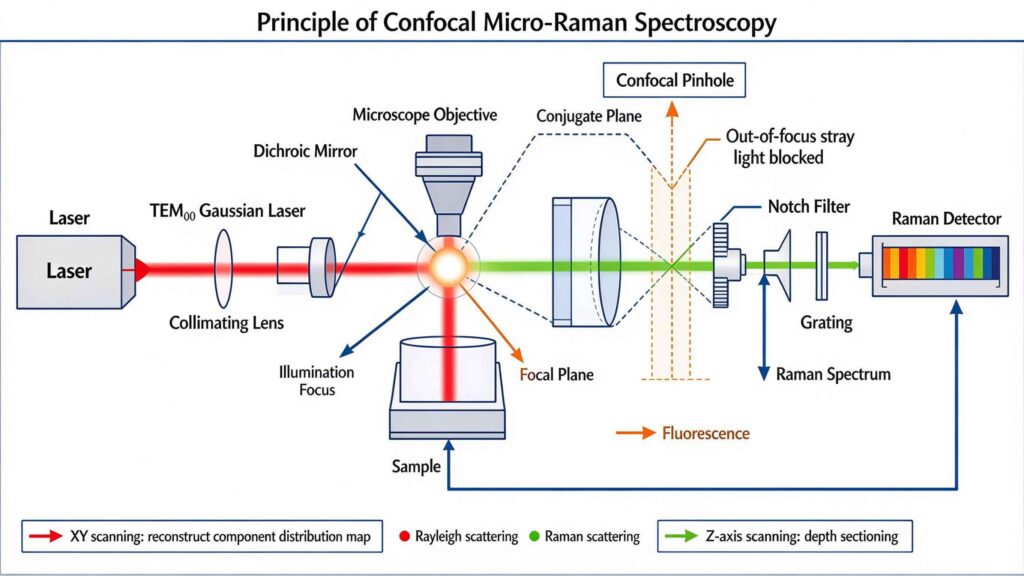
Figure 4. Schematic of the confocal micro-Raman optical path
The essence of confocal detection is the “common focal point”: in this optical system the excitation laser is focused on the sample to form the illumination focus, a confocal pinhole is placed in front of the detector, and the sample focus and the pinhole plane satisfy an optical conjugation relationship. During imaging, the laser focus or the sample is scanned point by point and line by line; only Raman scattering generated at the focal plane of the sample converges precisely through the pinhole and is received by the detector. This structure suppresses out-of-focus stray light by principle, achieving higher spatial resolution while lowering background noise.
3. Advantages of Confocal Detection
3.1 Suppressing the fluorescence background and improving signal usability
Fluorescence is one of the most common sources of interference in Raman measurements. When excitation light irradiates a sample, fluorescent species in the sample absorb photons and re-emit a broadband fluorescence signal. Because fluorescence is often far more intense than Raman scattering, once a sample fluoresces strongly a non-confocal system collects fluorescence generated both near the focal plane and in other regions of the sample. This broadband background can swamp weak Raman peaks and, in severe cases, make Raman measurement impossible.
A confocal system restricts the collection volume through the pinhole and receives only scattered light from the vicinity of the focus, so the fluorescence background is significantly reduced. For many non-fluorescent samples that were previously difficult to measure, confocal operation markedly improves spectral quality. However, if the sample itself fluoresces very strongly, or if the fluorescence originates from the region near the focus, confocal detection alone may not be sufficient. In such cases other measures must be combined even with a confocal configuration, such as selecting a more suitable excitation wavelength, optimizing the integration time or applying fluorescence-suppression techniques, in order to further improve the detectability of the Raman signal.
3.2 Depth sectioning and layer-selective signal separation
By controlling the spatial extent of excitation and collection, confocal micro-Raman can interrogate different depths of a sample layer by layer, making it suitable for samples with lamellar or three-dimensional structure. For transparent samples, the confocal system can acquire Raman spectra at different depths by adjusting the distance between the objective and the sample without damaging it, thereby reconstructing a three-dimensional chemical distribution image.
This is particularly important for thin-film samples. For example, for a thin layer grown on a substrate, if the film is only a few hundred nanometers thick while a non-confocal system probes several micrometers or more in depth, the collected signal will contain a large amount of substrate information and the Raman signal of the film itself may be masked. A confocal system confines the detection volume to the shallow layer where the film lies, reducing substrate interference and thus yielding more accurate structural information about the film.
4. Laser Source Selection for Confocal Micro-Raman Spectroscopy
4.1 Laser wavelength
The laser wavelength affects the intensity of Raman scattering. The Raman scattering intensity is proportional to ν⁴ (where ν is the laser frequency), and ν ∝ 1/λ, so the intensity scales as 1/λ⁴: the shorter the wavelength, the higher the laser frequency and the stronger the Raman scattering. At the same time, however, shorter wavelengths mean higher photon energy, which easily excites fluorescence that interferes with detection of the Raman scattering, and the high photon energy may also affect the sample.
4.2 Spectral linewidth
The spectral linewidth describes the width of the laser’s own spectral peak and determines the spectral resolution of the whole system. If the laser linewidth is too broad, adjacent Raman bands are merged and closely spaced characteristic peaks can no longer be distinguished, which is detrimental to crystalline-phase identification and quantitative stress analysis.
4.3 Output power and power stability
Laser power directly affects the signal-to-noise ratio of the Raman signal. Raman scattering is intrinsically very weak, so higher power yields a stronger Raman signal; however, excessive power causes photobleaching and thermal damage of the sample and destroys its original structure. The laser must also offer good power stability so that, during long mapping scans and Z-axis depth-sectioning acquisition, the signal intensity at different points remains stable, baseline fluctuations are reduced and spectral data remain comparable.
5. Recommended Laser Sources for Confocal Micro-Raman Spectrometers
RealLight Technology has been engaged in semiconductor laser research and development since 2010. Based on VBG (volume Bragg grating) frequency-locking technology, the company has developed a range of narrow-linewidth semiconductor laser devices covering the 532 nm-1064 nm bands commonly used in Raman spectroscopy, among which the 08LTR-mini and 14SBTF are single-mode laser modules.
The 08LTR-mini is a single-mode free-space narrow-linewidth semiconductor laser module of the RealLight NL series. Based on VBG wavelength-locking technology combined with a single-mode chip, it can integrate a TEC cooler, a PD photodetector and an RT thermistor, and provides stable locked-mode output under continuous-wave operation. Featuring a narrow linewidth, stable output, low temperature drift and a compact size, it is suitable for Raman spectral analysis.
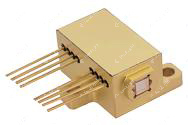
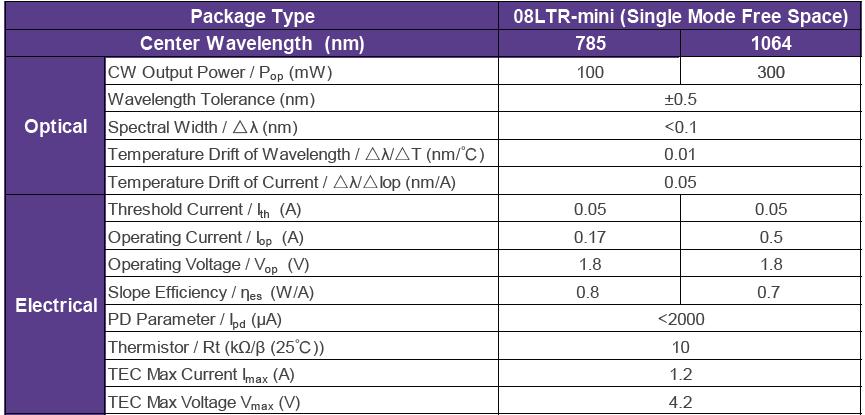
Figure 5. 08LTR-mini module (left) and its specification table (right)
The 14SBTF single-mode free-space module is the newest product in the RealLight NL narrow-linewidth laser product line. Based on VBG wavelength-locking technology combined with a single-mode chip, it provides stable locked-mode output under continuous-wave operation and excellent temperature-dependent wavelength drift characteristics, making it suitable for micro-Raman applications.
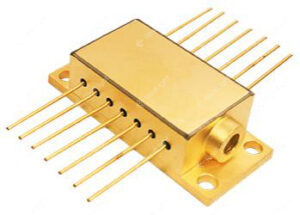
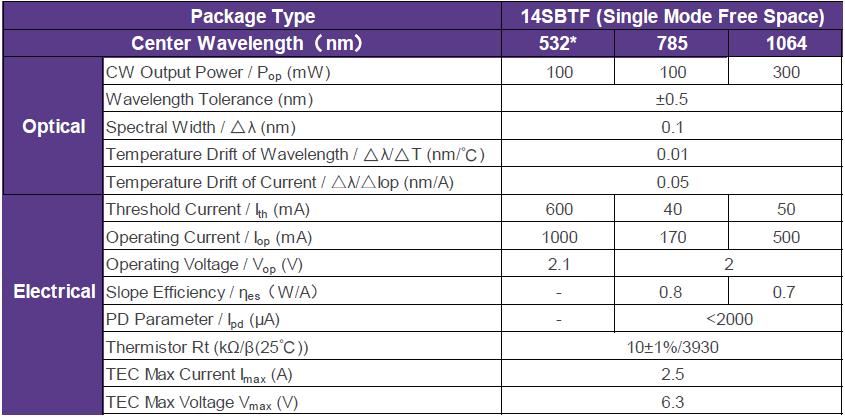
Figure 6. 14SBTF single-mode free-space module (left) and its specification table (right)
To facilitate integration, RealLight also offers the NLSO series of single-mode narrow-linewidth laser systems. Equipped with standard input and output interfaces, they can be readily embedded in customers’ instruments to provide highly stable narrow-linewidth laser output. The built-in laser and cooler control circuits give the product excellent spectral characteristics and power stability.
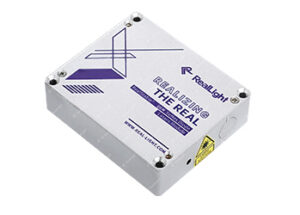
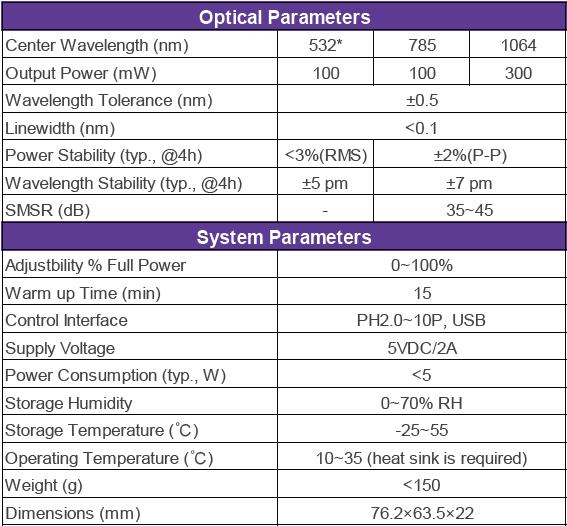
Figure 7. NLSO system (left) and its specification table (right)
Q&A
Q1: What are the core advantages of confocal micro-Raman compared with conventional micro-Raman?
A: (1) It suppresses the fluorescence and stray-light background originating from out-of-focus regions and improves spectral quality. (2) It provides depth sectioning (optical sectioning), acquiring signals layer by layer at different depths of the sample, reducing interference from substrate and other underlying materials, and is therefore suitable for non-destructive micro-area characterization of thin films and three-dimensional layered samples with higher spatial resolution. The principle relies on the optical conjugation between the sample focus and the confocal pinhole: only the useful signal from the focal plane can pass through the pinhole and reach the detector.
Q2: When selecting a laser for Raman spectroscopy, which key parameters deserve the most attention, and what is the effect of each?
A: (1) Laser wavelength: shorter wavelengths give stronger Raman scattering, but the higher photon energy more easily excites fluorescence and may also damage the sample. (2) Spectral linewidth: an excessively broad linewidth merges adjacent Raman bands and compromises crystalline-phase identification and quantitative stress analysis. (3) Output power and power stability: power determines the signal-to-noise ratio, while excessive power damages the sample; stable power ensures that spectral data from different points remain comparable during long mapping and Z-axis scans.
참고 자료
[1] Raman C V. A new radiation [J]. Indian Journal of Physics, 1928, 2: 387-398.
[2] Zhang P, Liu H. Advances in Raman spectral imaging technology [J]. Spectroscopy and Spectral Analysis, 2018, 38(6): 1729-1736.
[3] Yang X G, Wu Q L. Analysis and Applications of Raman Spectroscopy [M]. Beijing: National Defense Industry Press, 2008.
[4] Zuo J E, Gao C. Confocal micro-Raman spectroscopy and its applications: a review [J]. Journal of Instrumental Analysis, 2021, 40(2): 169-178.
08LTR-mini 단일 모드 자유 공간 협대역 다이오드 레이저 부품
14SBTF 단일 모드 자유 공간 협대역 다이오드 레이저 부품
NLSO 시리즈 단일 모드 협대역 다이오드 레이저 모듈
Disclaimer: Part of the content of this article is sourced from the Internet and is intended for technical research and exchange, for reference and learning only. Corrections of inaccurate descriptions or academic errors are welcome. If any copyright issue is involved, please contact us and we will verify and remove the relevant content as soon as possible.





 777